Customer churn - determine focus
Did you ever wonder how companies are able to target your specific needs in their email? Sometimes ads are scary precise in targeting your personal preferences, like they eavesdrop on you. In this small article, I show a basic example of determining a customer group target. The question I like to answer is: which customers are more likely to exit a bank and therefore may need support? For this analysis, I used a dataset from the data analytics site Kaggle. It is a dataset that can be used for small AI and data analysis projects.
Where to start? Well, let's first take a decent look at the data itself. We see, for example, that the total amount of customers in the dataset is 10,000. Of these 10,000, approximately 20% exited. If we consider the gender, we see something interesting. Females tend to churn more than males: 16% for Males, 25% for Females. Another datapoint is the amount of balance customers have in their accounts. If we separate the data into buckets, we notice that customers with a balance between 10,000 and 13,000 have a relatively higher exit rate. Lastly, it shows older customers have a higher exit rate. Summing up: there are some variables that deviate in their exit rate.
Now, what would we really like to distill from this dataset? It is interesting to understand how to prevent existing customers from leaving. We, therefore, have to predict whether the current customers are likely to leave. There are multiple machine learning techniques to determine this. For now, I have chosen the Random Forest method as the dataset includes multiple variables, it is a classification problem, the data is labeled, and it is a relatively small dataset. The goal is to determine a churn probability per customer which can be used to target communication strategies. If a customer has complained, they almost all also exit, therefore, this variable is not very interesting for analysis.
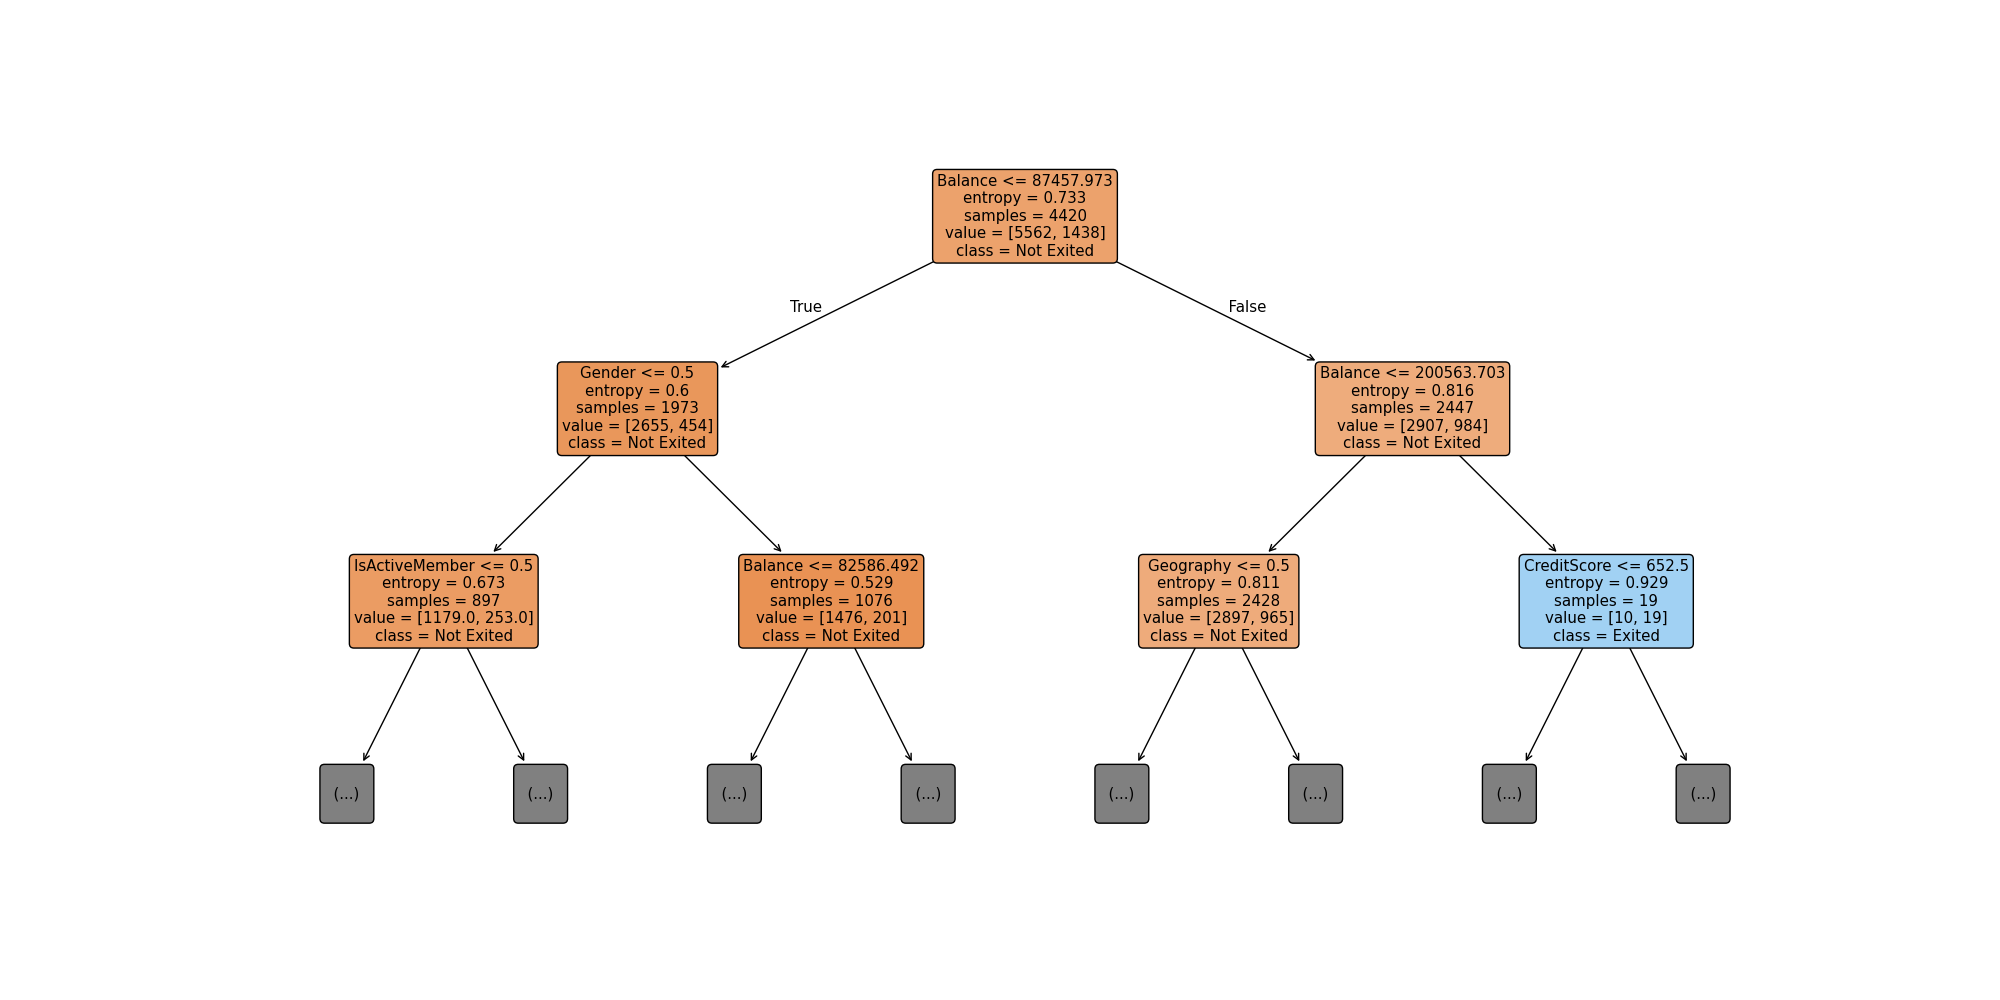
What is entropy?
Entropy is the parameter that shows how many observations of one class is present in the node. Let's say we have a 0.5 Entropy and a two class tree, then half of the sample is class 1 and the other class 2. The model optimizes the Entropy per node by changing the decision criteria.
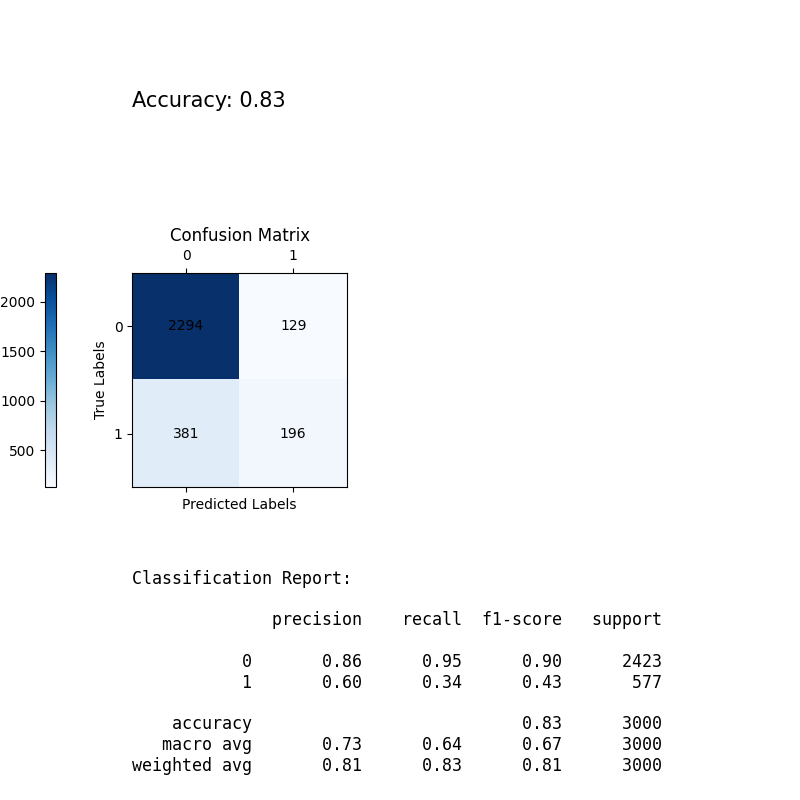
Let’s take a look at the parameters of the Random Forest model. The model has an accuracy of 83% after some trial and error with variables. The confusion matrix represents the predicted labels against the actual labels. Zero in this case means not exited, and one means exited. Therefore, in 381 cases the model predicted no exit, while it was an exit. In 196 cases, it predicted an exit, and it turned out to be an exit. You get the idea. The classification report elaborates on the accuracy. The model predicts a churn correctly 60% of the time relative to all exits predicted by the model. The recall for exiting is 34%, meaning there is a 34% chance that the model correctly determines an exit against the total actual exits. Combining the two values provides an F1-score of 43%. Therefore, the accuracy of predicting a churn should be considered carefully. It is not highly likely that a prediction is accurate.
| CustomerId | Churn Probability |
|---|---|
| 15795488 | 0.96 |
| 15797960 | 0.93 |
| 15699523 | 0.92 |
| 15595609 | 0.90 |
| 15623314 | 0.90 |
Nevertheless, how can we put this model into a practical perspective? The model determines the probability of a customer churning that has not yet exited. As the table shows we now know a churn probability per customer, we can anticipate our actions based on these characteristics. A company could actively reach out to customers with a high probability to churn and support them. Of course this is a model and therefore the prediction will not always be accurate, but the essence is that now we have focus. Maybe this will improve customer satisfaction and hopefully resolve some irritation. In the end, don't we all want to have a bank process that is as easy as possible?
If you want to read more about the topic, some references:
-
Dash, S. (2022). Decision Trees Explained - Entropy, Information Gain, Gini, Index, CCP Pruning (Medium)
-
Burkov, A. (2019). The Hundred-page Machine Learning Book. Andriy Burkov.